Alignment Process

Social Determinants of Health
The social, economic, and environmental factors that influence an individual’s health outcomes and well-being.

Atlanta, GA, Census tracts 13121007100 & 13121007002
The social vulnerability score for census tract 13121007100 is 0.95, and for census tract 13121007002, it is 0.83. Both scores are high compared to Fulton County's score of 0.66 and DeKalb County's score of 0.79. (source: 2022 U.S. CDC, Social Vulnerability Index)
The overall Environmental Justice Index score for census tract x7100 is 0.99, and for census tract x7002, it is 0.94. Their Environmental Burden scores are 0.94 and 0.77, respectively, both indicating a high level of risk (source: 2022 CDC, 2022 Environmental Justice Index.)
There is a high percentage of adults over 65 years old in census tract X7100 (19.7%) and X7002 (10.5%), which is approximately 1.64 times higher than Atlanta's 12.0% and 0.88 times lower than Atlanta’s percentage, respectively (source: 2022 U.S. Census American Community Survey, DP05.)
There is a very high percentage of African American/Black population in both census tracts X7100 (90.2%) and X7002 (92.8%), significantly higher than Atlanta's 47.6% and U.S.'s 12.5%, with X7100 being nearly 7 times higher than the U.S. average (source: 2022 U.S. Census American Community Survey, DP05.)
The White population is very low in both census tracts X7100 (3.4%) and X7002 (2.4%), compared to Atlanta (40.8%), Fulton County (41.0%), and DeKalb County (31.9%), which all have significantly higher percentages (source: 2022 U.S. Census American Community Survey, DP05.)
There is 0% Asian population in both census tracts X7100 and X7002, whereas Atlanta has 4.9%, Fulton County has 7.6%, and DeKalb County has 6.2%, all of which are very low percentages (source: 2022 U.S. Census American Community Survey, DP05.)
The other ethnicity population is low in both census tracts X7100 (6.4%) and X7002 (4.8%). X7002 has a lower percentage than the surrounding areas (7.7% - 13%), while X7100’s percentage is close to the Atlanta average but still lower than Fulton and DeKalb counties (source: 2022 U.S. Census American Community Survey, DP05.)
The Hispanic/Latinx population is very low in both census tracts X7100 (5.3%) and X7002 (0%). X7002 has virtually no Hispanic/Latinx population, whereas X7100’s percentage is slightly below the Atlanta average (5.4%). (source: 2022 U.S. Census American Community Survey, DP05.)
The median household income in the past 12 months is very low in both census tracts, with X7100 at $29,016 and X7002 at $54,217. X7100’s income is approximately 2.7 times lower than the U.S. median of $75,149, while X7002's is still below the Georgia median of $71,355 (source: 2022 U.S. Census American Community Survey, S1901.)
The census tract and surrounding area are classified as a food desert, with limited access to affordable and nutritious food options (source: 2019 USDA Food Access Research Atlas.)
The food insecurity rate is high in both census tracts, with X7100 at 38.1% and X7002 at 25.4%. These rates are significantly higher than the U.S. average of 13.9% (source: 2021 CDC PLACES.)
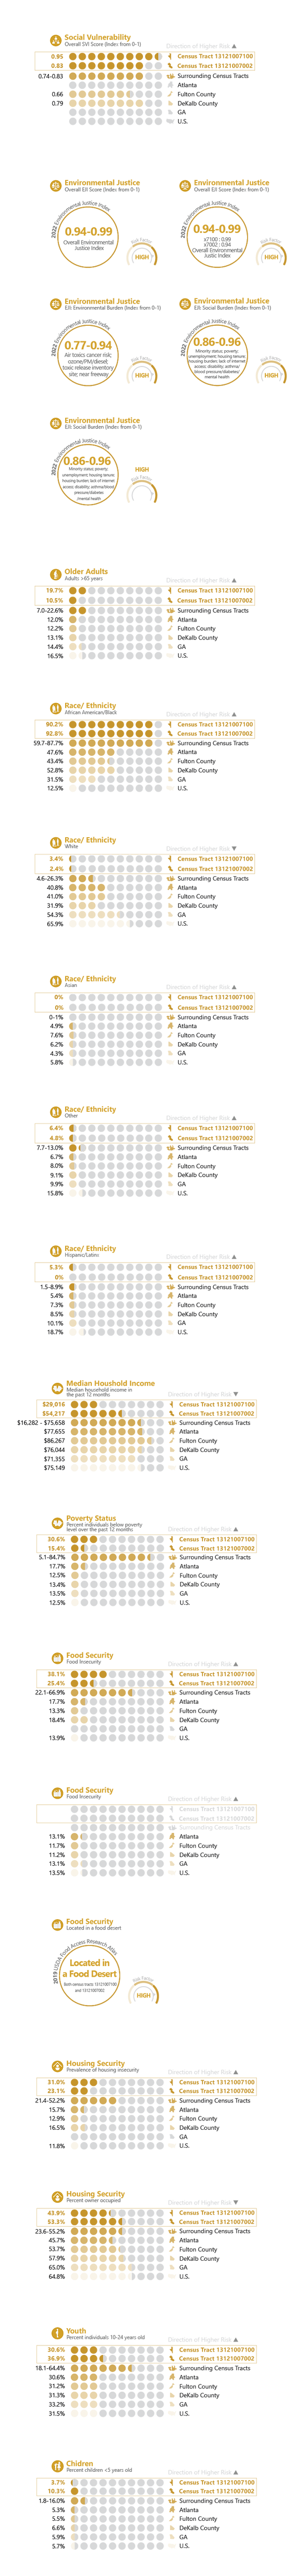
The social burden for census tract X7100 is 0.96, and for census tract X7002, it is 0.86, both of which are high compared to the neighborhood census tracts X6802 (0.81) and X3802 (0.91)(source: 2022 CDC, 2022 Environmental Justice Index.)
The percentage of individuals below the poverty level over the past 12 months is high in both census tracts, with X7100 at 30.6% and X7002 at 15.4%. X7100 is nearly 2.5 times higher than the Georgia average of 13.5%, while X7002 is still above the U.S. average of 12.5% (source: 2022 U.S. Census American Community Survey, S1701.)
The food insecurity rate in Atlanta is moderate at 13.1%, which is similar to the average for Georgia (source: 2022 Gundersen C, Strayer M, Dewey A, Hake M, Engelhard E. Map the meal gap 2021: An analysis of county and congressional district food insecurity and county food cost in the United States in 2019. Feeding America. 2021.)
The prevalence of housing insecurity is high in census tract X7100 at 31.0%, which is 7.9% higher than X7002 at 23.1%, but both are lower than X6802 at 52.2% (source: 2021 CDC PLACES.)
The percent of owner-occupied housing is moderately low, with X7100 at 43.9% and X7002 at 53.3%, both lower than Fulton County at 53.7% and DeKalb County at 57.9%. (source: 2022 U.S. Census American Community Survey, S2502.)
The census tracts have an average percentage of individuals aged 10-24, with X7100 at 30.6% and X7002 at 36.9%, similar to Atlanta’s 30.6% and Georgia’s 33.2% (source: 2022 U.S. Census American Community Survey, DP05.)
The percentage of children under 5 years old is moderately low in census tracts X7100 at 3.7% and X7002 at 10.3%. In comparison, the neighboring census tract X6802 has a high percentage of 16.0%, which is approximately 4 times higher than X7100 (source: 2022 U.S. Census American Community Survey, DP05.)
Explore More

Click to download Metadata